 IT
IT  ES
ES Weekly Italpreziosi Report –April 13
Weekly Italpreziosi Report –April 13
16 April 2018
REPORT 13TH OF APRIL 2018
The war trails have continued to blow without interruptions for all the week: the tones between United States and Russia have tightened up and ,hour after hour, the worries about an impending war in Syria, which would see involved numerous geopolitical actors- European included- are increasing. In the forefront, among the favorable to a military operation, we find the Leaders of France and United Kingdom- Macron and May: those last ones declared themselves ready to attack Syria but Germany and Italy excluded any kind of military attendance (but they offered logistic support for the offensive). The attitude of the White House stays ambiguous: Trump (via Twitter)has warned Moscow to have the intention of hurling a missile offensive, except then add (at less than one hour from the first Tweet) that the Russian economy needs the United States and the relationships between the two powers they don’t necessarily need to be so warlike. According to several politic analysts (and the markets seem to confirm it) the hypothesis of a war- even thou it is not to be totally excluded- it is not that close now as some very little diplomatic tones want to intend: a kind of déjà-vu that remembers very closely the attitude recently held by Washington towards The North Korea. In fact, it would seem that to mostly scare the markets it isn’t the ghost of the war fought with missiles, but rather the spectrum of another war, the commercial one: on one side against Beijing (fought with custom duties) and on the other side against Moscow (fought with sanctions). The effects of this last one are already more than touchable, if we just think that the quotations of the future at 3 months on the aluminum listed at the London Metal Exchange (LME) have reached a peak of 2277,50$ per ton: according to what Bloomerg quotes (and recovered by the Sole24Ore) we are dealing with the most “intense” rally since 1988 until now. To take benefits from the custom duties against Russia we find even the palladium. The price of this metal (whom really lasted for practically 2 years was loosing its strength), it has closed the week with the sign plus going back almost to 1000$/oz. During the week also the minute od FED and BCE have been published. The frame traced by the two central institutes hasn’t been so different from the ones from the previous months. Both in Europe and in the United States the growth is going on stable, despite the fact that among the FED board members some worries about the commercial war against China have emerged. This is an element which during the medium and long term it would have strong negative impacts on the global economic trend. And to confirm that there are inflows in the ETF having the gold below them: the Xetra Gold is at its maximum level since the moment in which it was launched for the first time, in 2007.
GOLD (XAUUSD)
totally flat week for the quotations of the yellow metal, even thou the abovementioned risks still continue to give a more than valid support to the price. In particular, during the day of Wednesday 11th of April, the quotations recorded a spike that touched the 1365$/oz, together with the Trump’s warlike Tweets. But the alarm stopped a little bit later, abrading all the earnings for the following day, with the quotations that stabilized around the 1330$/oz. The price is going anyway much more above the mobile daily averages at 100 and 200 days. The trend remains on a lateral/bullish position: to be monitored the support in the area of the 1300- 1310$/oz and the resistances in the area of 1350- 1375$/oz.
WEEKLY GRAPHIC XAUUSD (Main Supports and Resistances)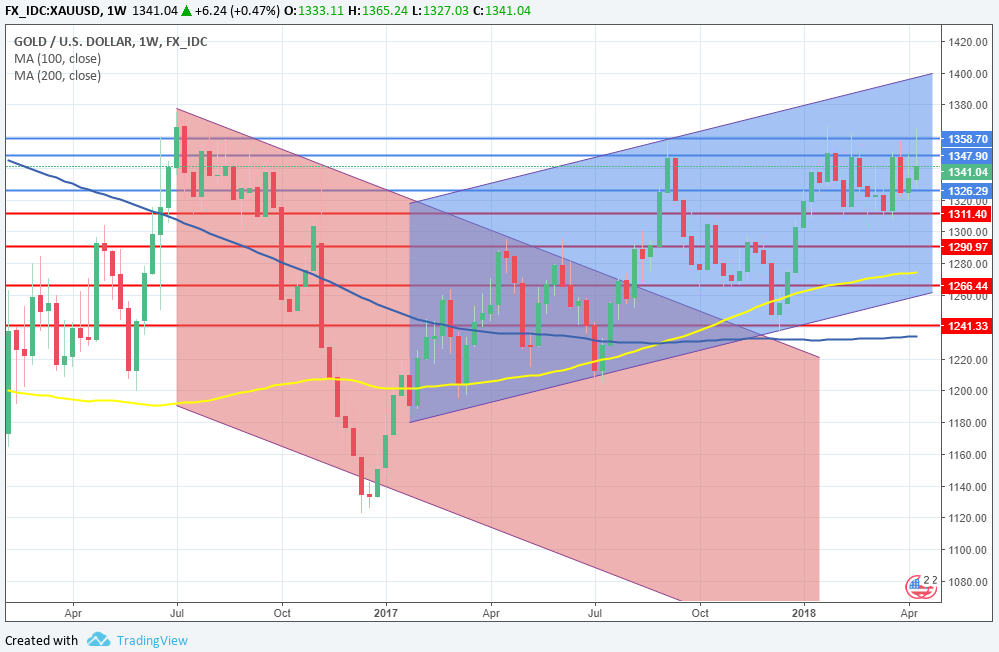
To be noted- on the monthly graphic- that the price of the metal listed in dollars has already broken, since several months, the bearish trendline (see the blue line), and the minimum recently scored are still on increasing levels. This usually is a bullish signal which leaves a hopeful signal to further extends, especially within a long-term temporal axis. However, it would seem that the mobile average at 100 (monthly) is doing resistance, considering the fact that it has exceeded the quotations of the last nine months (see the yellow line).
MONTHLY GRAPHIC XAUUSD (Main Supports and Resistances)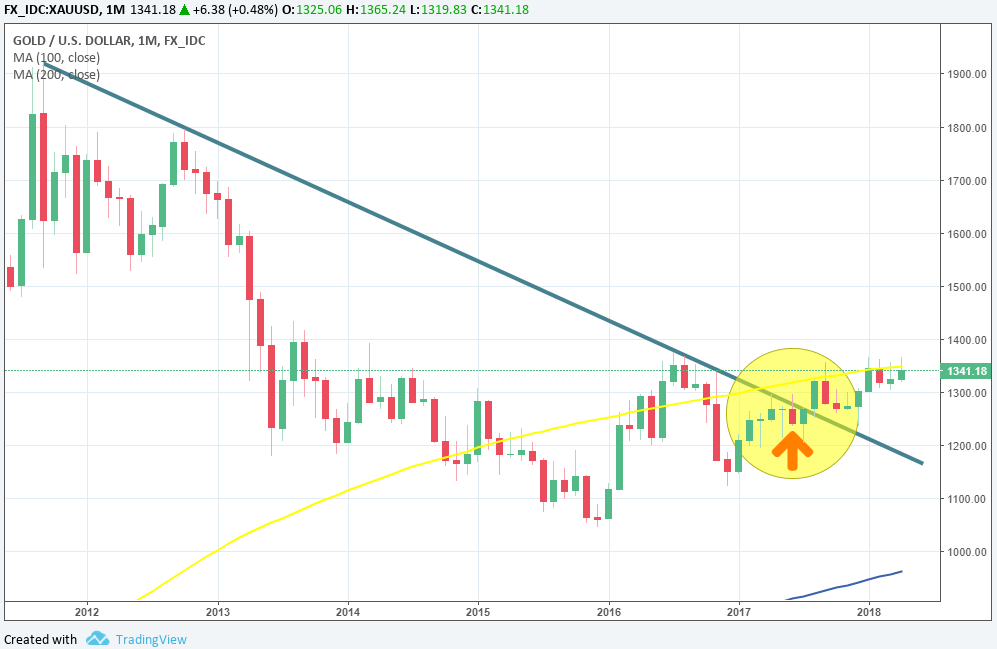
SILVER (XAGUSD)
Yet another week of flat calm even regarding the quotations for silver. The price of the metal is still imprisoned (for the eleventh consecutive week) in the area of 16,10 – 16,90$/oz, pointing out a week interest by the investors. The trend (differently from gold) stays bearish and, at the moment, such strong drivers sufficiently powerful to take a decisive direction toward the market are still not noticed. On the technical level, just a crack in the area of 17,40 – 17,50$/oz (therefore much more above the mobile weekly averages at 100 and 200 days) it would trigger further stretches up to the test of the strong resistance put in the area of 18.50$/oz.
WEEKLY GRAPHIC XAGUSD (Main supports and resistances)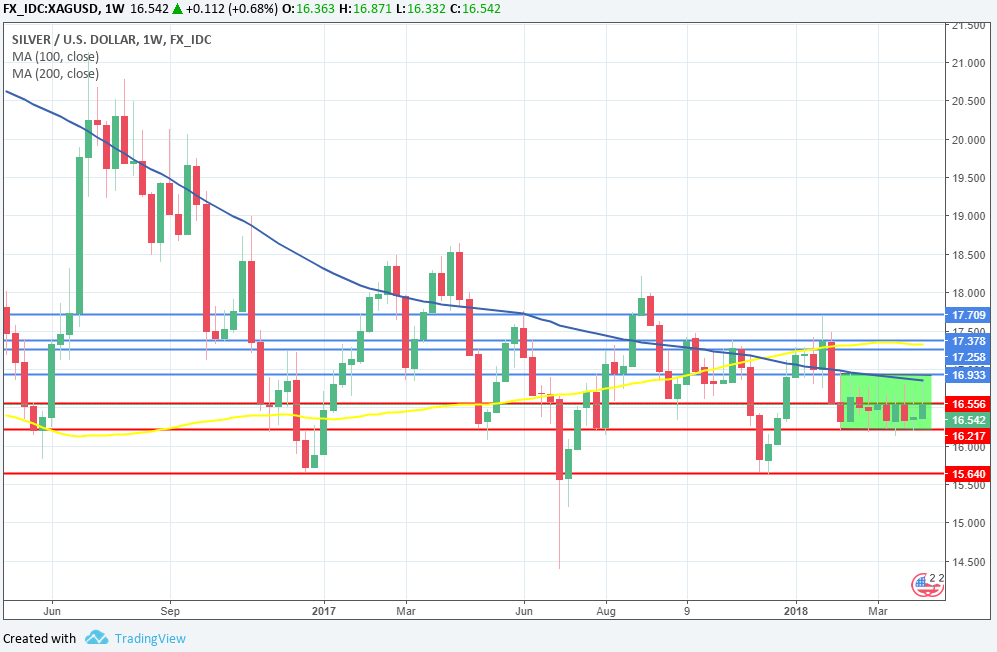
PLATINUM (XPTUSD)
During the week, a light rebound for the platinum which it still remains, however, channeled on a bearish trend , after the strong bullish upsurge that has characterized the prices within the first two months of the year. The dynamics of the metal price are influenced by the excess of supply: as already mentioned in the previous report the extractive over capacity would characterize the market during the whole year. The analysts are rather pessimistic: if, on one side, they admit that quotations are at present relatively low (especially if they are compared to the gold), on the other side they wonder which kind of drivers could be able to lift again the interest up.
WEEKLY GRAPHICS XPTUSD (Main supports and resistances)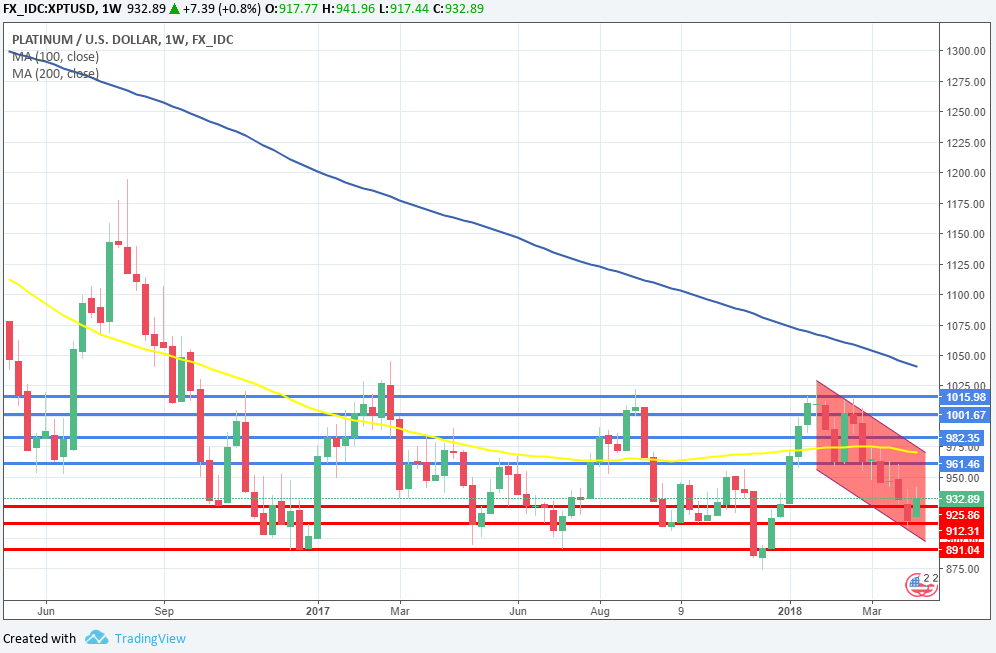
PALLADIUM (XPDUSD)
During this week the palladium takes back the losses of the last two previous weeks and it tries on more time to go back to the primary bullish channel at 1000$/oz. The area 910 – 900$/oz it revealed to be an excellent support especially after the recent sanctions against Russia (first world producer). The trend stays positive. However, to be monitored the developments within the automotive market: a cooling down of the sector would moderate the quotations despite the supply deficit which the market is currently experiencing.
WEEKLY GRAPHIC XPDUSD (Main Supports and Resistances)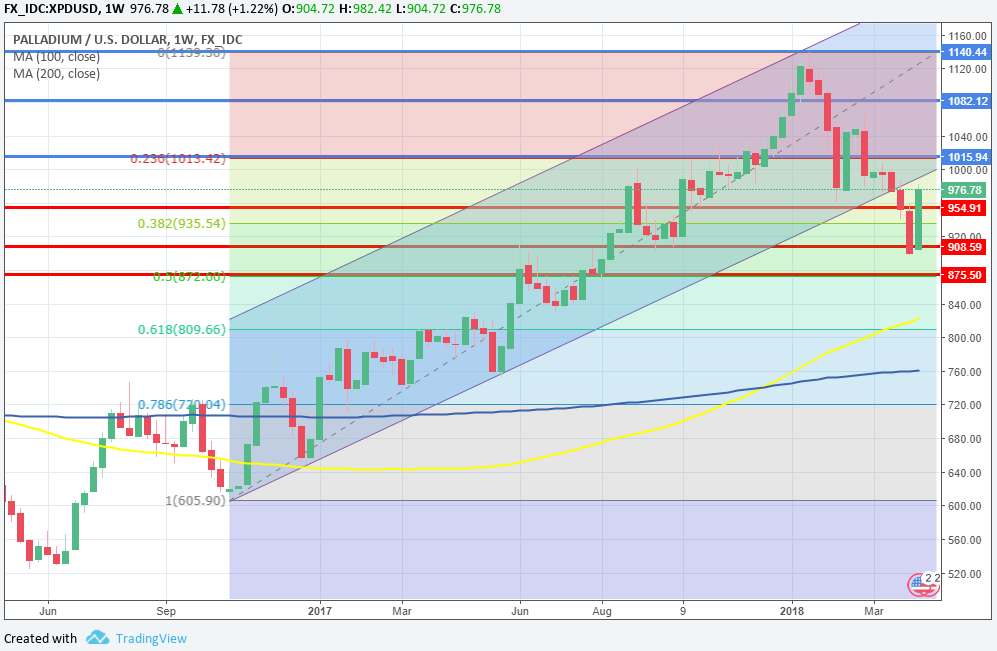
EURODOLLAR (EURUSD)
Unchanged, almost since one year, the Eurodollar scenario. The exchange rate stays in an equilibrium phase (underlined by the yellow triangle): on one hand it is bought (the currency is preferred to the dollar by the investors in that phases of the market where major risks are felt), on the other hand it is sold (because the European economy is at the moment less strong than the American one). The trend remains lateral- bullish. The main supports and resistances are down at 1.20 and up at 1.25.
WEEKLY EURODOLLAR GRAPHIC (Main Supports and Resistances)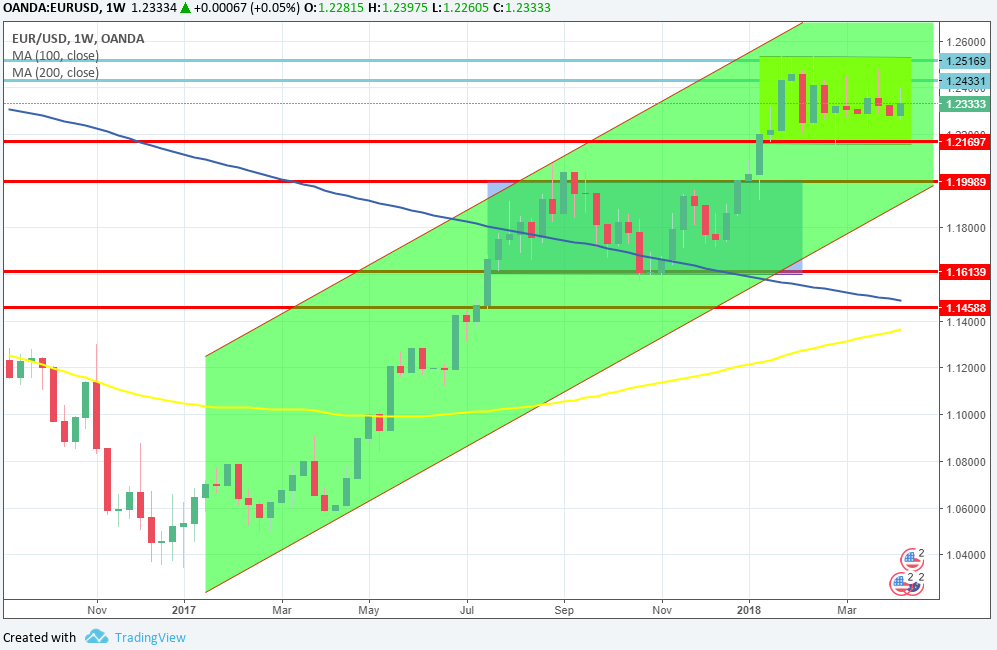
BRIEFLY …
|
GOLD |
Resistances |
1365 |
1375 - 1380 |
|
Supports |
1235 - 1250 |
1310 - 1350 |
|
SILVER |
Resistances |
17,35 |
17,70 - 18 |
|
Supports |
15,60 - 16,15 |
16,62 -16,65 |
|
PLATINUM |
Resistances |
1010 |
1030 - 1045 |
|
Supports |
890 |
900 - 910 |
|
PALLADIUM |
Resistances |
1000 |
1075 - 1100 |
|
Supports |
900 - 910 |
950 -985 |
|
EURUSD |
Resistances |
1,21 – 1,22 |
1,25 – 1,27 |
|
Supports |
1,1850 |
1,19 |
Sources: Bloomberg, IlSole24Ore, Commerzbank.
LEGAL NOTICES
Italpreziosi S.p.a. does not guarantee any result related to the information, publications made and present in the news, or it assumes no responsibility for the outcome of any financial transactions performed by you.
You expressly agree to understand that access to information on the site does not represent a solicitation to buy or sell financial products and that any resulting operational decisions are taken in full autonomy and at your sole risk.
By virtue of these terms of use no liability can be incurred by Italpreziosi S.p.a. for losses, damages or missing and / or minor gains that the reader would suffer as a result of executing transactions based on news reading.