 IT
IT  ES
ES PRECIOUS METALS OUTLOOK - September 2018
PRECIOUS METALS OUTLOOK - September 2018
19 September 2018
September 15th 2008 – September 15th 2018
MACROECONOMICS
Ten difficult, intense and uncertain years have passed since Lehman Brothers Holdings announced its intention to use Chapter 11, "formalizing" the start of the Great Recession. That event literally disturbed the world in financial, economical, human and ethical terms. In fact, it has uncovered a system made of nefarious speculation, lack of controls and non-sustainability, which has deteriorated the real economy and directly impacted the life of regular people.
Once globalization and digitalization has connected every corner of the world, the majority of countries was financially and economically linked. This fact contributed to widespread the pessimism and left National Governments to deal with an unprecedented crisis.
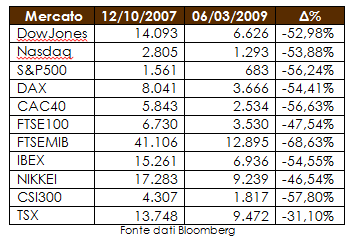
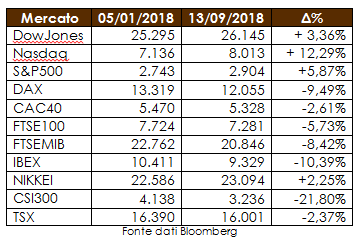
The financial effects were noticeable, as markets have reported heavy losses since the beginning of October 2007, until the minimum recorded in March 2009:
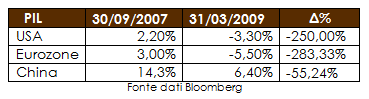
A general look at the GDP trend of the three major global players evidences the concrete consequences of the crisis, even if China’s economic deterioration was somehow attenuated, at least if compared to the US and Eurozone’s experiences:
Facing this critical situation, the main Central Banks decided to launch extraordinary reform policies, lowering the cost of money in order to support the economy: the so-called quantitative-easing programs. It has begun, then, a long period of liquidity injection in the banking system, in the expectation of encouraging investment, growth and also employment rates, which was at critic levels in both the US and the Eurozone (registered unemployment rate of 8.7% and 9.3%, respectively, in March 2009).
The results were multiple: on the one hand, GDP growth actually resumed and, additionally, the liquidity flows have been used to nourish mainly the financial system and national debts. This can be verified from the historical data below:
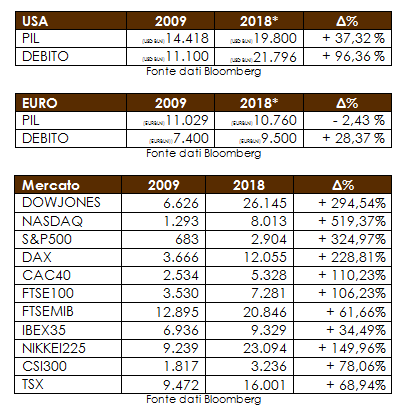
The figures above bring to the conclusion that financial markets have strongly benefited from the capital inputs made by the FED and the ECB. Yet, the stimulus has not been equally fruitful to the real economy: in the US, the GDP growth reached the modest level of 28% in ten years, while in the Euro area the result was, instead, a 2.43% GDP contraction in the same period.
There are two main explanations for these different outcomes. The first one is that the European Community has started the money injections with a considerable delay compared to the US, and the second one is the non-cohesion of its State members. In fact, what actually has been revealed during the last ten years was the absence of a real Union, one that should be able to make fast and targeted decisions to protect all members in the same extension. We have seen that Germany and France had stood out on the other actors, and have economically led the EU and also benefited from the intra-union disparities. The value added by them to the whole system is illustrated by their stock markets performance: + 228% and + 110%, respectively.
The perception that Europe was lacking a real Union was concretely demonstrated in June 2016, with the unexpected British vote on Brexit, officially sanctioning Great Britain’s exit of the European Union. The fact has further undermined the delicate balance of the community, and the growth of ultra nationalist parties in the old continent represents nowadays an alarm bell to authorities. In this sense, it is imperative that the Union must act as soon as possible to diminish fiscal, legal and economic barriers (not borders), so it can compete equally with the other big economic and financial poles, that are, US and China. As it is said: unity is strength.
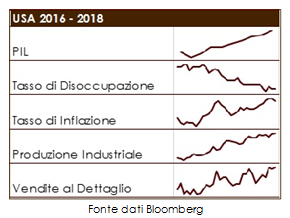
If the Eurozone still struggles to recover, with a GDP of 2.1%, an unemployment rate of 8.2% and negative industrial production of -0.1%, data from overseas are the opposite: GDP growth at 2.9%, unemployment at 3.9% and industrial production at 4.26%. The good performance has been influencing the US interest rates policy, and economical authorities had already resumed nominal rates gradual hikes: the 10-year Treasury interest rate is back to the 3% level, alongside with the 3M interbank rate of 2.33%, This is drawing a substantial displacement of capital from the Eurozone to the much profitable US financial market, as the first one presents return rates below zero (Euribor 3M: -0.31%).
The Asian giant, instead, shows fairly stable data, both from an wealth point of view, with GDP growth at 6.7% and Industrial Production at 6%, and from an employment standpoint, with the unemployment rate at 3.83%. To threaten this balance, however, President Trump decided, in March 2018, to establish a trade war against China, using import tariffs as his offensive. Using a parallel with the “Risk” board game, the two superpowers are now deploying their tanks.
2018 ANALYSIS
In the first half of 2018, markets were mainly influenced by the US trade policy, which pointed to a probable surrender of the multilateral agreements order that have been dominating economic relations since the end of the Cold War.
Under the "America first" slogan, President Donald Trump announced the imposition of a 25% and a 10% tariff on steel and aluminum imports, respectively, to all countries in the world, except for a list of four nations that have successfully negotiated a permanent exemption (South Korea, Argentina, Australia and Brazil). The governments of those countries excluded from the "VIP list", in particular China and the EU, responded with retaliations, establishing a "trade war" environment and strongly influencing stocks, currencies and commodity markets.
A protectionist approach from the US would have sent a pessimistic signal to markets. This is theoretically true, since less trade results in lower levels of global economic growth. But the interesting point is that, at the same time, US macro data showed that Trump's election promises has, until now, proven to be economically effective, even if controversial.
As mentioned earlier in this report, market reaction in front of Us performance was that of displacing investments to the country, causing a considerable appreciation of US stock markets compared to those of the old continent.
In addition to the appreciation of the US dollar, the euro has been under pressure due to concerns on the Brexit agreements, the refugee crisis and the political and economic turbulences in Turkey and Hungary. Thus, after a long period of uptrend, during which prices reached their highest level in 4 years at 1,255 Eur/Usd (02/2018), the exchange rate reversed to a downward trend since April 2018.
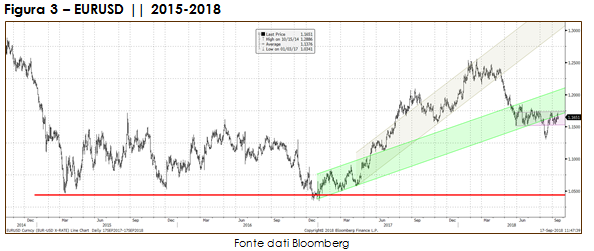
As seen from the chart, the lowest level that the Euro reached compared to the US currency was in mid-August 2018 (1.1299 Eur/Usd), when the market priced the expectation of a great exposure of European banks to Turkish investments, following the weakness of the Turkish lira.
Technically, it is important to monitor price levels highlighted by the horizontal area on the previous chart: support at 1.15 Eur/Usd and resistance at 1.18 Eur/Usd. If the market breaks the support, the next test level could be 1.13 Eur/Usd. In the event of an upturn, it is reasonable to think that prices could regain upward momentum, towards 1.18 Eur/Usd and then 1.20 Eur/Usd.
PRECIOUS METALS
Gold Spot Market
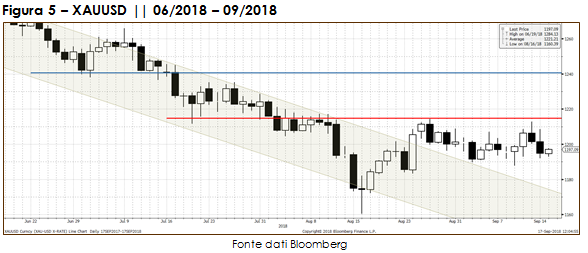
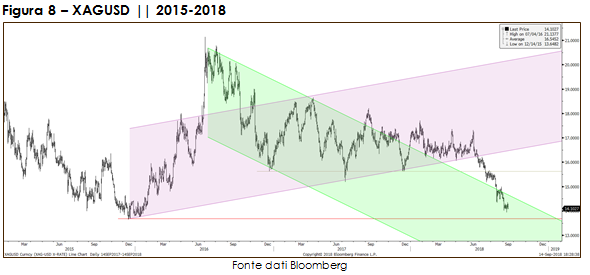
Since the beginning of the year, after reaching $ 1365/oz, gold spot market volatility decreased significantly, with prices fluctuating within a side channel for around 5 months.
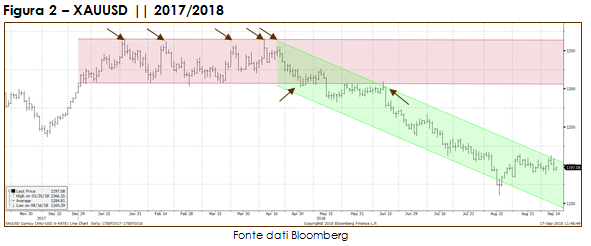
The yellow metal unsuccessfully tried to break the resistance of $ 1365/oz five different times. This imposed much technical downward pressure on prices and, combined with a positive US macroeconomic scenario, which led investors to place money on US equities and currency, reversed the former bullish trend that dated from the end of 2016.
After breaking the side channel support in May 2018, prices tried again to operate above this level. But, at that time, the selling side proved to be more vigorous, and prices accelerated downwards and have been working within the green bearish channel since then, reaching a minimum of $1160/oz in Mid-August.
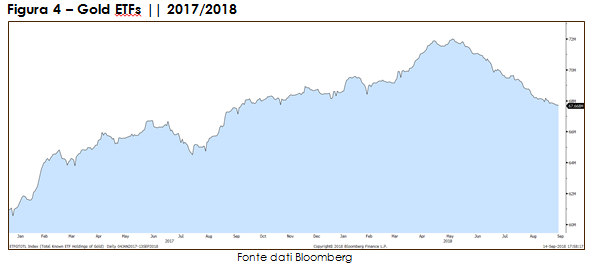
Gold price struggle can be observed also from the Gold ETFs dynamic, as it have undergone a massive net liquidation: from May 2018 onwards, the total quantity of gold held by the funds returned to the lower levels of July 2017.
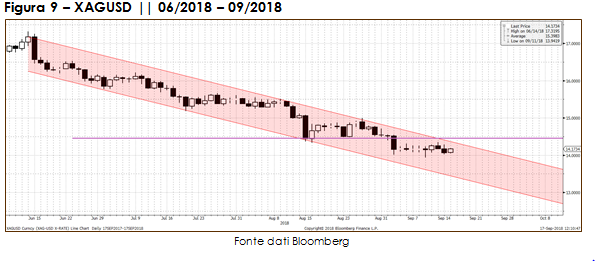
Currently, the former levels of support became the new resistance ones, and the market has been trying to break them since the beginning of August 2018. The recent decrease in volatility is creating an area of congestion and, at the next breaking point, prices could resume moving with more impetus.
In one way or another, technical signs do not seem to be bullish in the short run. Indeed, unless external actors bring new concerns or pressure to the financial market, gold spot prices may remain below the short-term resistance of $1215/oz.
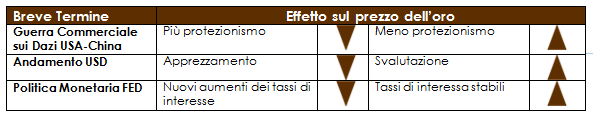
One probable external factor might be the US dollar, as gold prices seem very sensitive to its behavior in the last weeks. Considering that, it is imperative to monitor the political aspects of Sino-american relations: from an economic point of view, many analysts argue that China would be the big loser from further constraints to international trade, as it is the largest net exporting country in the world. Therefore, a worsening of those bilateral negotiations could favor the US currency and, as a result, weigh negatively on gold prices.
Alongside, investors and analysts will be particularly alert in terms of the Fed's monetary policy, as good economic data in the US would be encouraging authorities to continue raising interest rates, at least until the end of 2018.
In such a manner, it will be very important to observe the market activity in the next weeks, as in case of surpassing $1215/oz, gold could again find strength to reach the resistance level at $1240/oz. To the contrary, $1160/oz mark could represent the edge of the abyss, beyond which prices could collapse until $1120/oz.
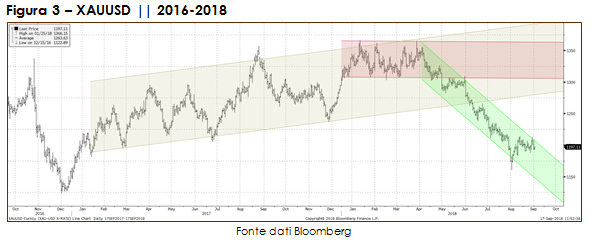
In regard to gold prices in Euro, it is possible to see the decisive downtrend in progress, with market currently operating on the lowest part of the red channel. Interestingly, the dollar appreciation has been more pronounced versus raw materials rather than against the Euro, and has not been respecting the historical inverse correlation, which places the two currencies, Euro and Us dollar, as antagonists.
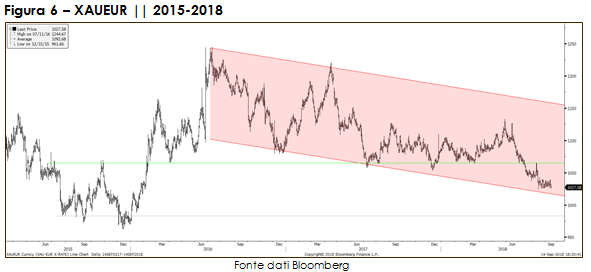
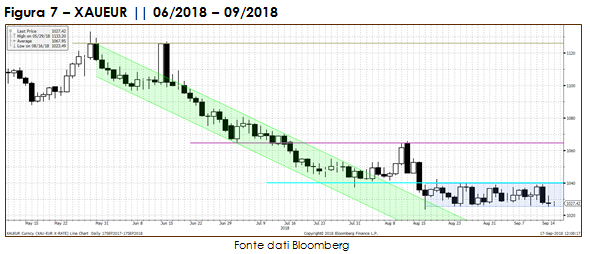
In other words, the appreciation of the US currency was not translated into a depreciation of the Euro currency and, finally, into an increase of gold price in Euros. In fact, gold in Euro exchange suffered a sharp decline, which brought prices to the lows of January 2016. Currently, prices remain in a side channel between $1025/oz and $1040/oz, so the mid-term trend highly depends on prices behavior within this area.
Silver Spot Market
In the silver market, price dynamic has been very similar, if not more prominent than in spot gold: the appreciation of the US dollar pushed down heavily the gray metal, bringing it to the lows of the last 3 years, towards the share of $14/oz. This is a decisive level, as a downward rupture could bring prices back to the area last seen before 2010, and even towards the historical minimum of $10/oz. Nevertheless, some analysts ponder that, at current prices, the market seems to offer a good buying opportunity, and it would not be a surprise to see this theory to materialize given the steady physical demand for metal.
Even in the short term, as seen below, the chart leaves little space for imagination: the current trend is distinctly bearish, with a direction towards the $13/oz mark. In this case, only a strong break in the resistance above $14.5/oz could bring back impetus to silver prices, and push it back over $15/oz.
TO MONITOR
Disclaimer: This report has been produced by ITALPREZIOSI S.p.A. Arezzo – Italy and has no connection with investments or financial situations of any type. This report is not a call to buy or sell any of the financial products described. ITALPREZIOSI S.p.A. cannot be held responsible for the correctness or validity of prices and opinions expressed that are subject to change at any moment without warning. No guarantee whether it be explicit or implicit is given for the accuracy, fullness, reliability or trustworthiness of the information in this report. ITALPREZIOSI S.p.A., its directors, employees and agents are not therefore responsible for any loss or damage deriving from reliance on such information, prices or opinions.